
If you have worked in SQL Server 2000 and were used to using the T-SQL debugger, you might have lamented it’s absence in SSMS in SQL Server 2005. In SQL Server 2005, one can debug the stored procedures using Visual Studio though and that works really great as well. In SQL Server 2008, MSFT has re-introduced the debugger into SSMS. In today’s post, we will pick up a stored procedure in the AdventureWorks database and will go through the features of the debugger – it is nothing different than other debuggers that you have used but it is nice to know that for folks who rely on using only SSMS for their stored procedure work, they do not need to use VS to help debug in an effective manner.
In the BOL, all of the information pertaining to the debugger is under Transact-SQL Debugger. If you have both the client tools and the server running on the same machine, then there is no configuration needed to use the debugger. However, if you are using the client tools from one machine to connect to the database server on another machine, then you need to enable port and program exceptions by using the Windows Firewall Control Panel application on both the client and the server. We will look into those and other security related issues pertaining to the debugger in an upcoming post. In this post, we just want to go through an example of the debugger.
So, let’s prepare an execution script for executing a stored procedure in the Adventure Works database:
declare @x datetime
select @x = GETDATE()
exec [uspGetBillOfMaterials] 799, @x
select @x = GETDATE()
exec [uspGetBillOfMaterials] 799, @x
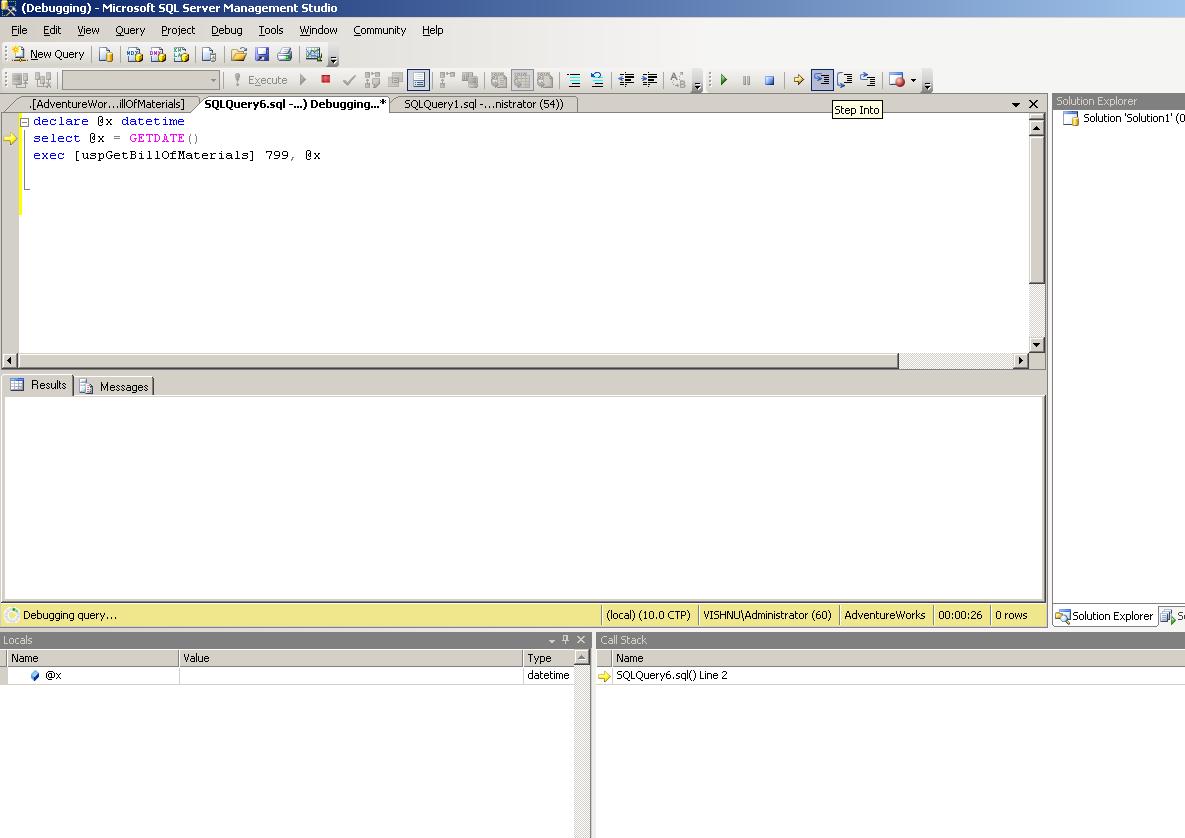
And now, press the debug button as shown in the image below – this will launch the debugger:
Once the debugger launches, you will see the different debug options at the top – Step Into, Step Over, Step Out, breakpoints etc. and at the bottom, you will see two windows – one for the local variables/Watch and the other one a call stack/Breakpoints/Command Window and the Output – these are tabbed interfaces. Here is the image that shows that:
And now, let’s step into the call to the procedure and you will see the local variable values and in the call stack, you will see the actual call.
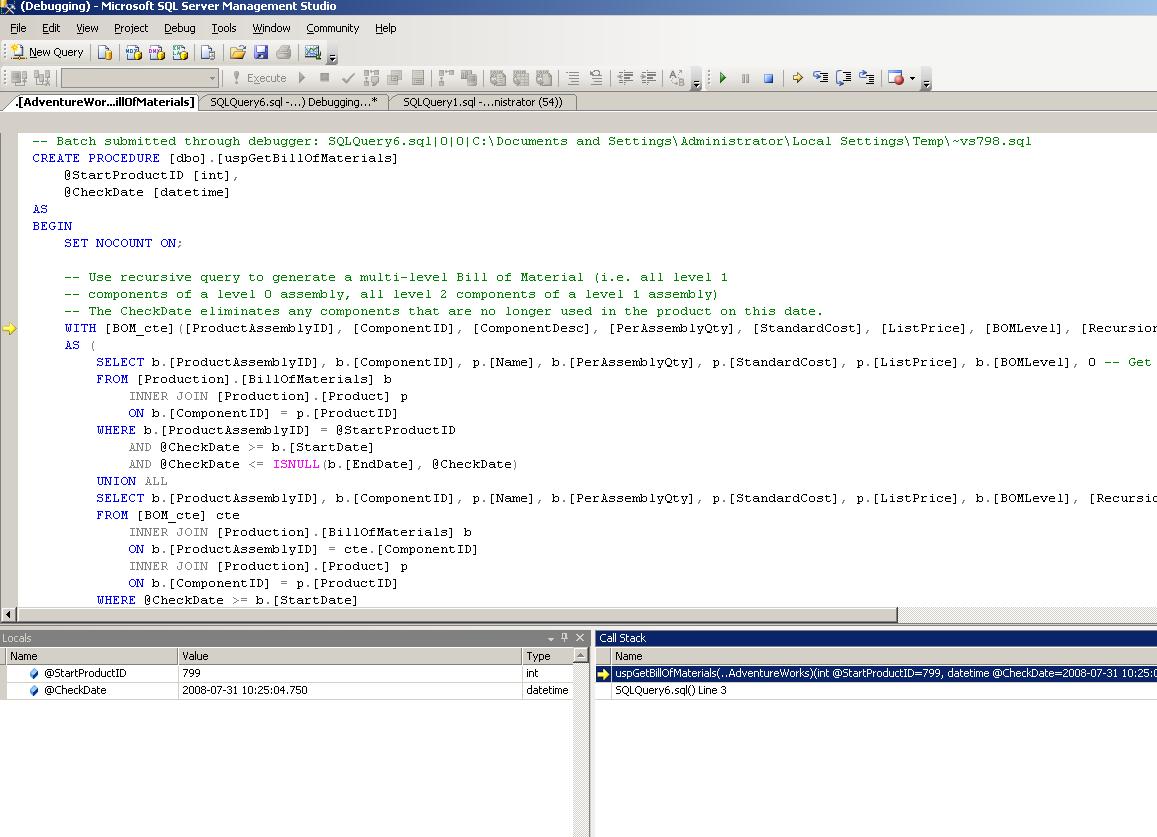
This particular procedure only has a CTE which executes and returns back the records so it will exit out as we process through it and will return back the records. Using the debugger, troubleshooting issues becomes easier especially in the case of larger procedures and the nested procedures which call other procedures or views/functions.
No comments:
Post a Comment